Transmission trees & superspreader epidemiology
Published:
An overview of our paper: “An open-access database of infectious disease transmission trees to explore superspreader epidemiology” published in PLOS Biology.
This project began when I participated in the Population Biology of Infectious Diseases REU at the University of Georgia where I was first exposed to the field of disease ecology!
Many thanks to my mentors Dr. Paige Miller and Dr. John Drake for their support and to our reviewers who provided constructive feedback.
I previously shared a similar thread on Twitter and have expanded it here for clarity and posterity.
We constructed a public database of infectious disease transmission trees and used it to address questions about superspreader epidemiology. Check out the database here.
Transmission trees visualize infectious disease transmission between individuals as a network, with nodes representing individuals and branches representing transmission from person to person in a directed manner.
The database
The database contains 382 trees spanning 16 directly-transmitted diseases. Trees range in size from 2 to 286 cases, with outbreaks taking place between 1946 and 2020. We recorded reported information about transmission setting, age, and gender, among other characteristics.
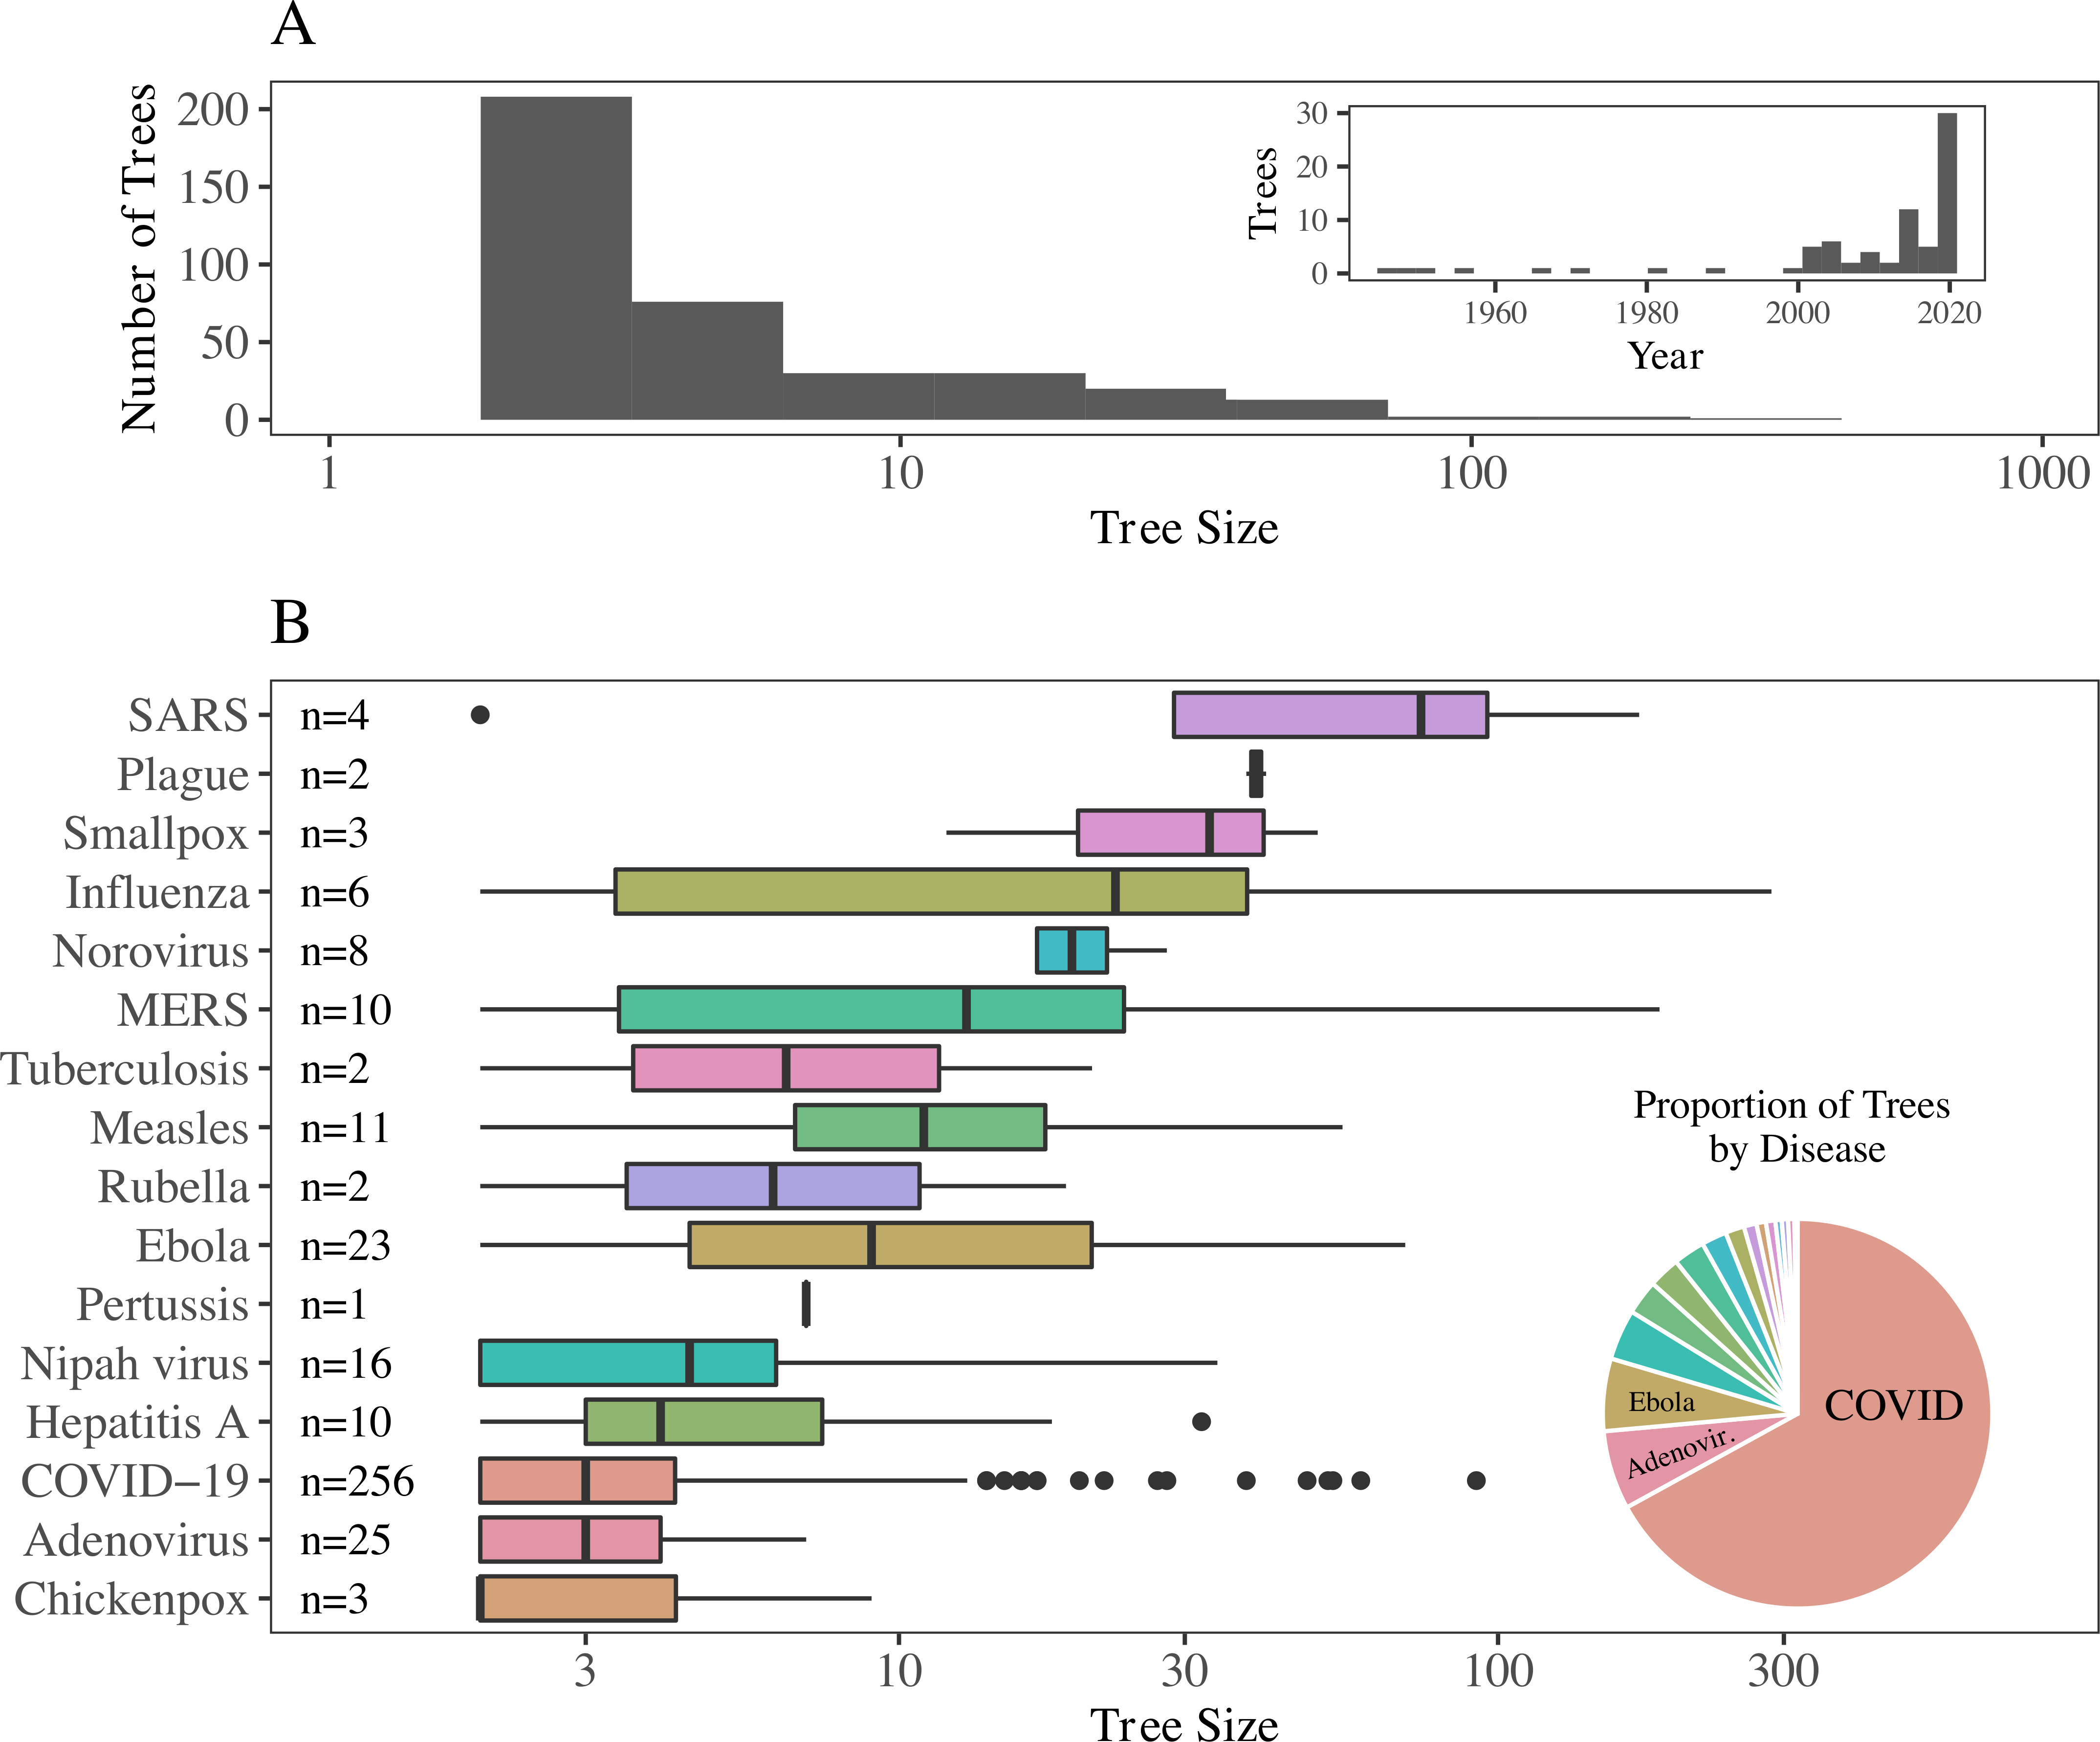
Analysis
To analyze the trees, we had to consider critical assumptions about outbreak investigation bias and completeness that affect estimates of R and the dispersion parameter, k. R is the basic reproduction number or the average number of secondary cases in a fully susceptible population. The dispersion parameter describes the variability in onward transmission across individuals; counterintuitively, high dispersion parameters indicate that most individuals generated the same number of secondary cases while low dispersion parameters indicate that there was substantial variation in number of secondary cases generated by each individual. We conducted our analyses assuming transmission trees are either complete (meaning all transmission events have been observed) or incomplete and compared the results.
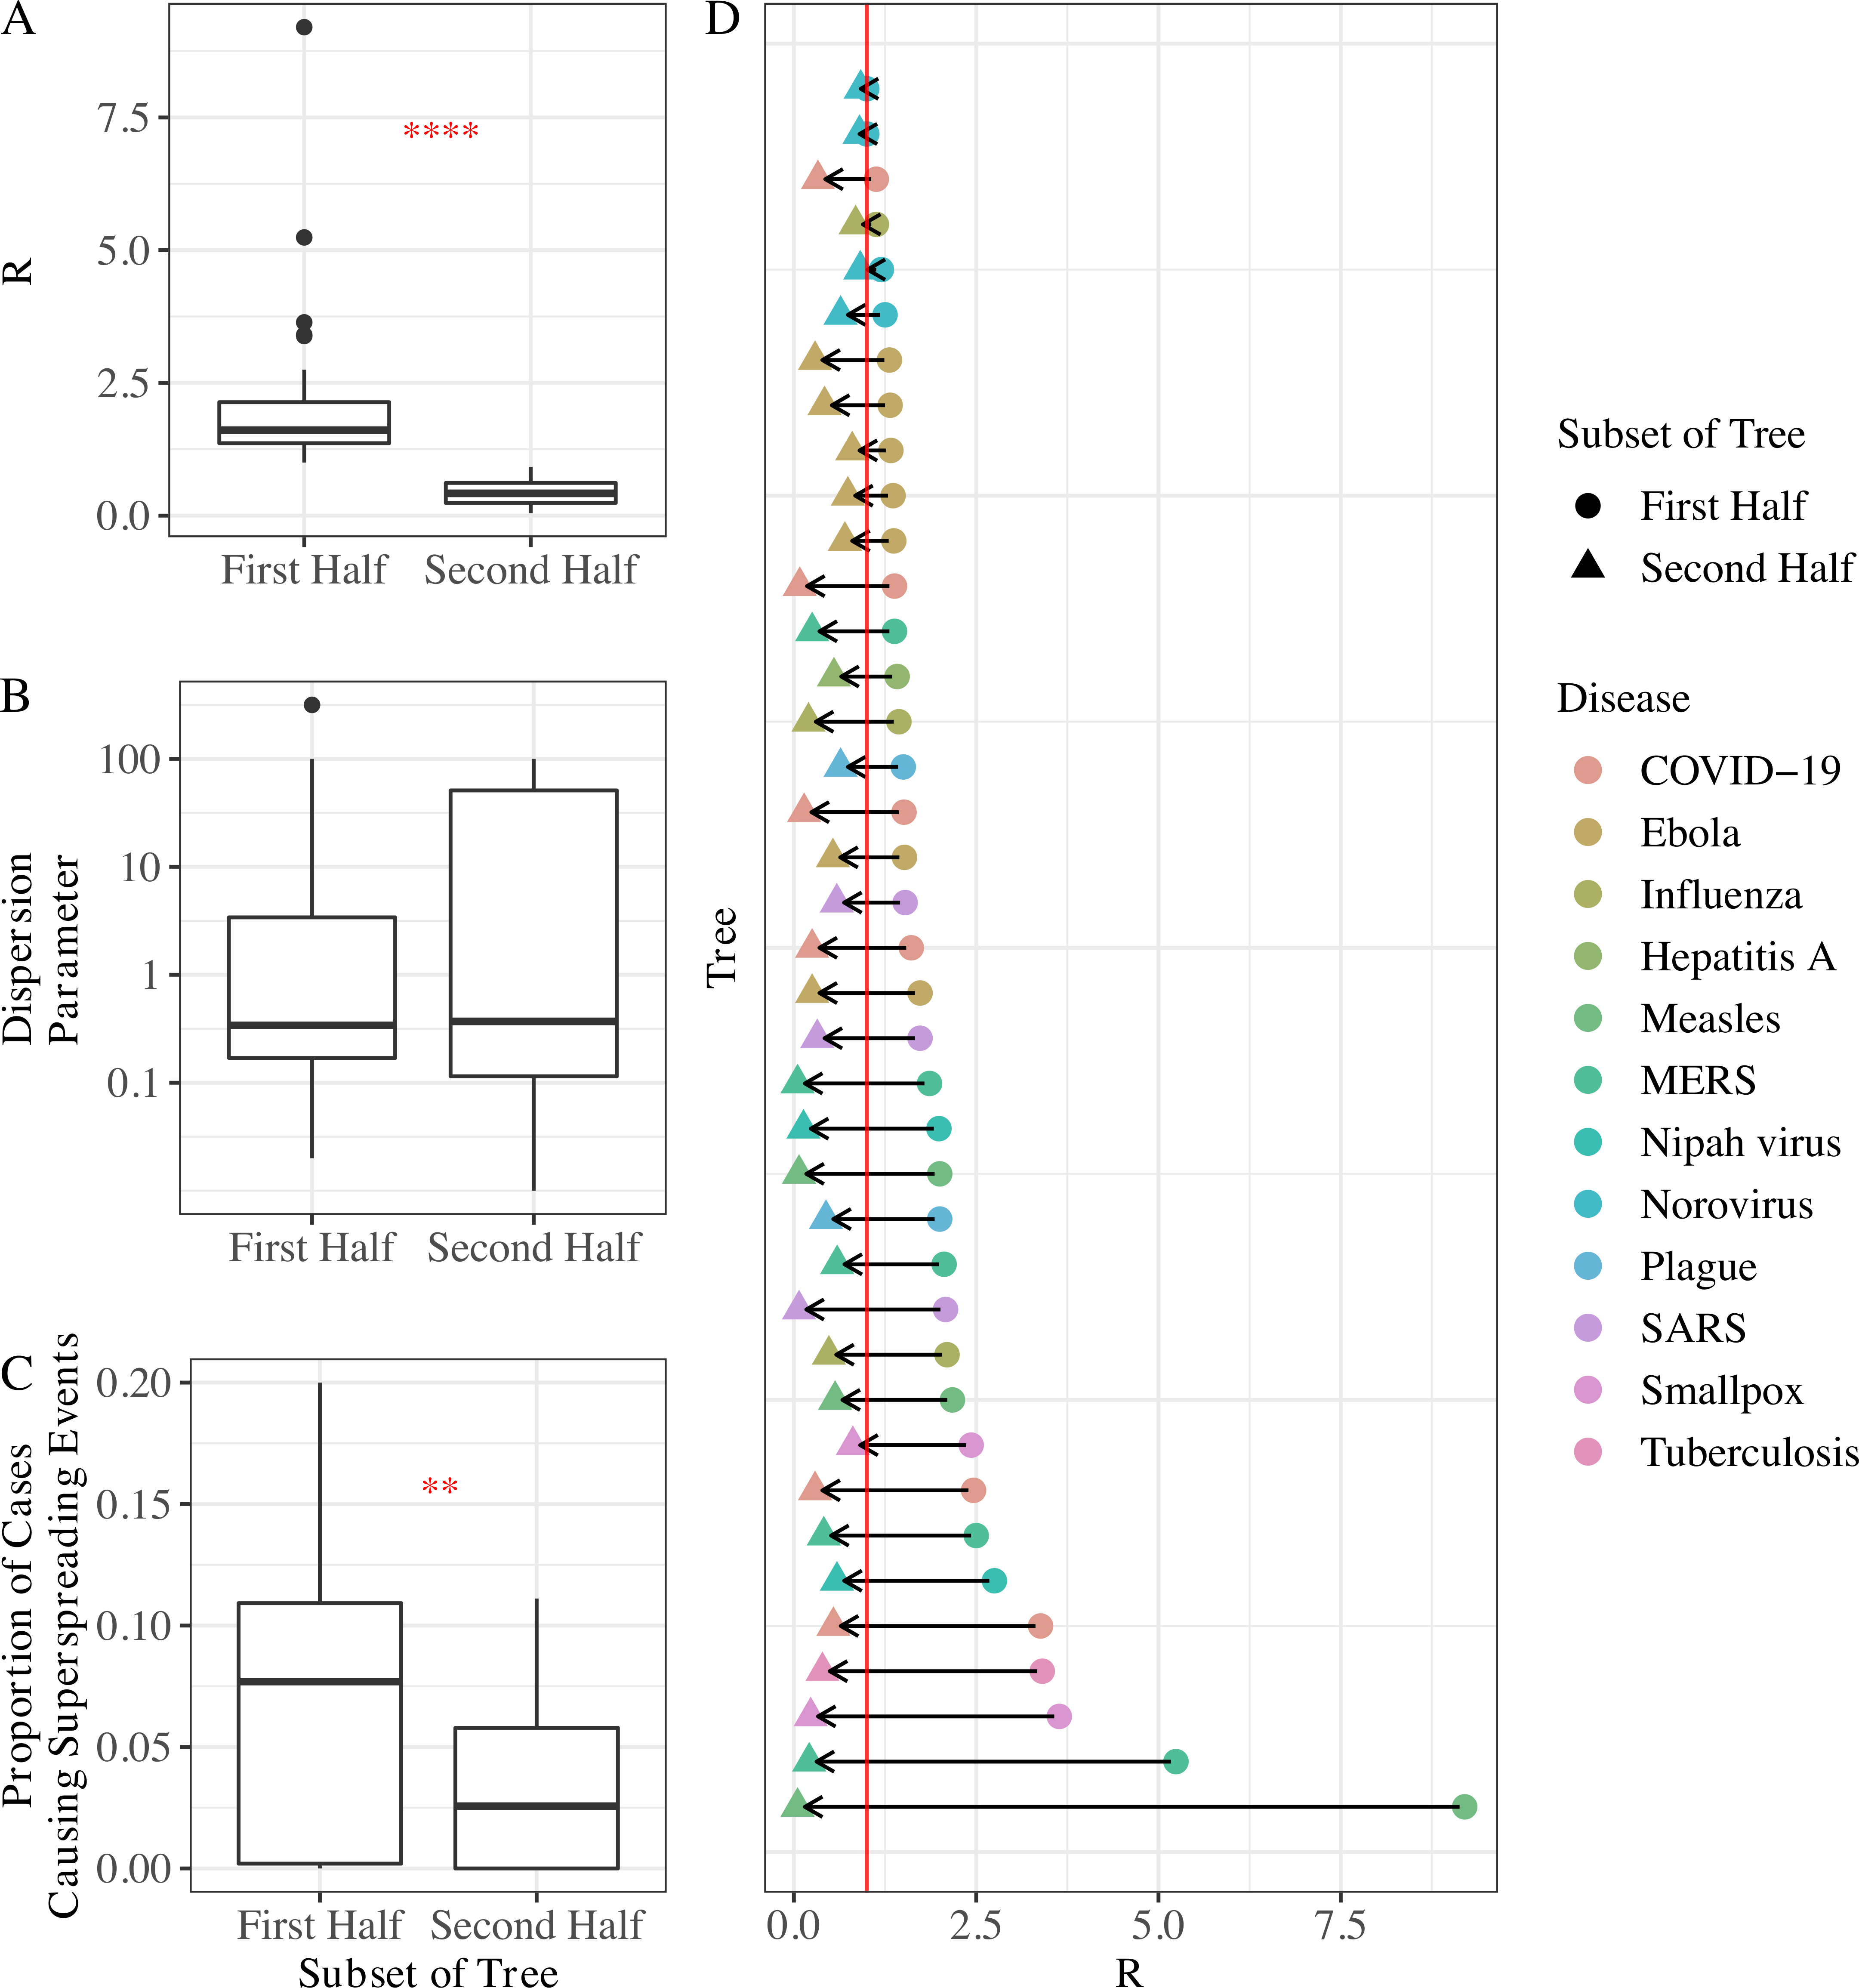
Lacking data on the timing of control measures for each tree, we compared R, k, and the frequency of superspreaders (i.e., the proportion of cases causing superspreading events) in first vs second halves of larger trees as a proxy for the effect of control and/or behavior change. R and the frequency of superspreaders decreased significantly in the second half of trees, perhaps as a result of control efforts or differences in human behavior due to increased awareness.
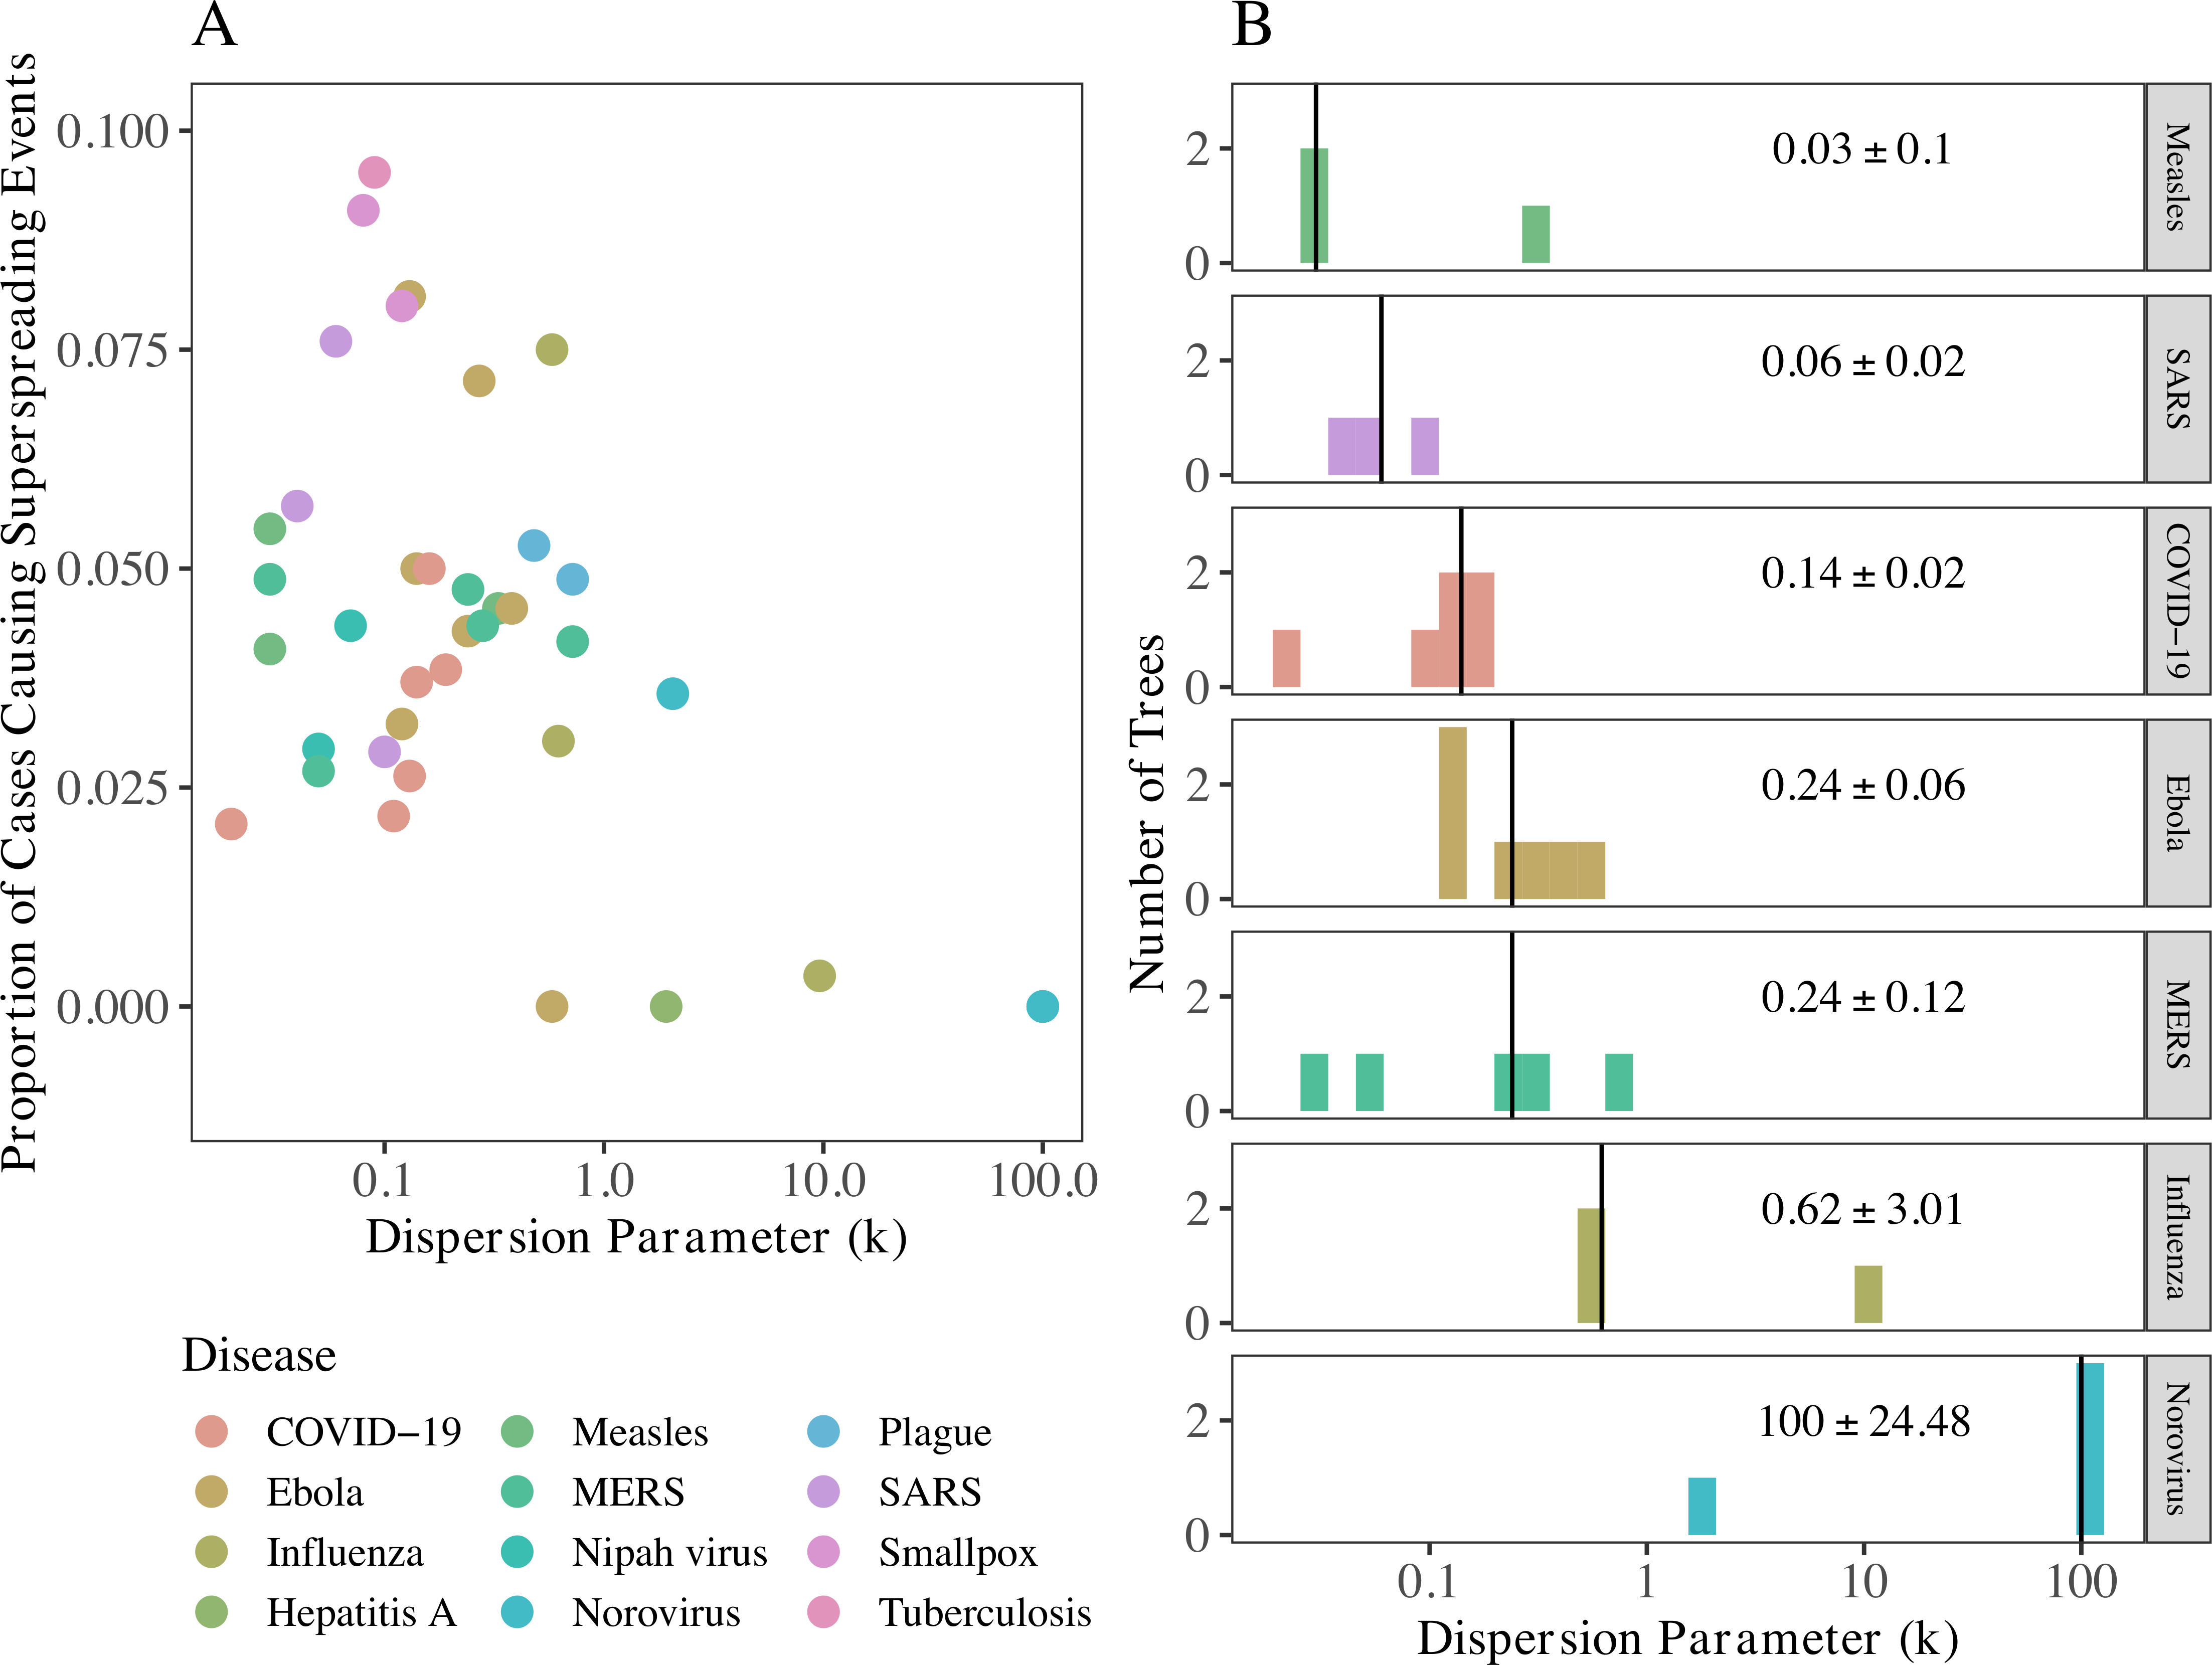
We also tested and found support for Lloyd-Smith and colleagues’ 2005 theory that intermediate k values are associated with the highest proportion of cases causing superspreading events. In other words, too much or too little variation in onward transmission tends to limit the number of cases deemed superspreaders; this is likely tied to how superspreading is defined and we used the same definition as Lloyd-Smith et al. We estimated k for COVID-19 in 2020 to be between that of SARS and MERS.
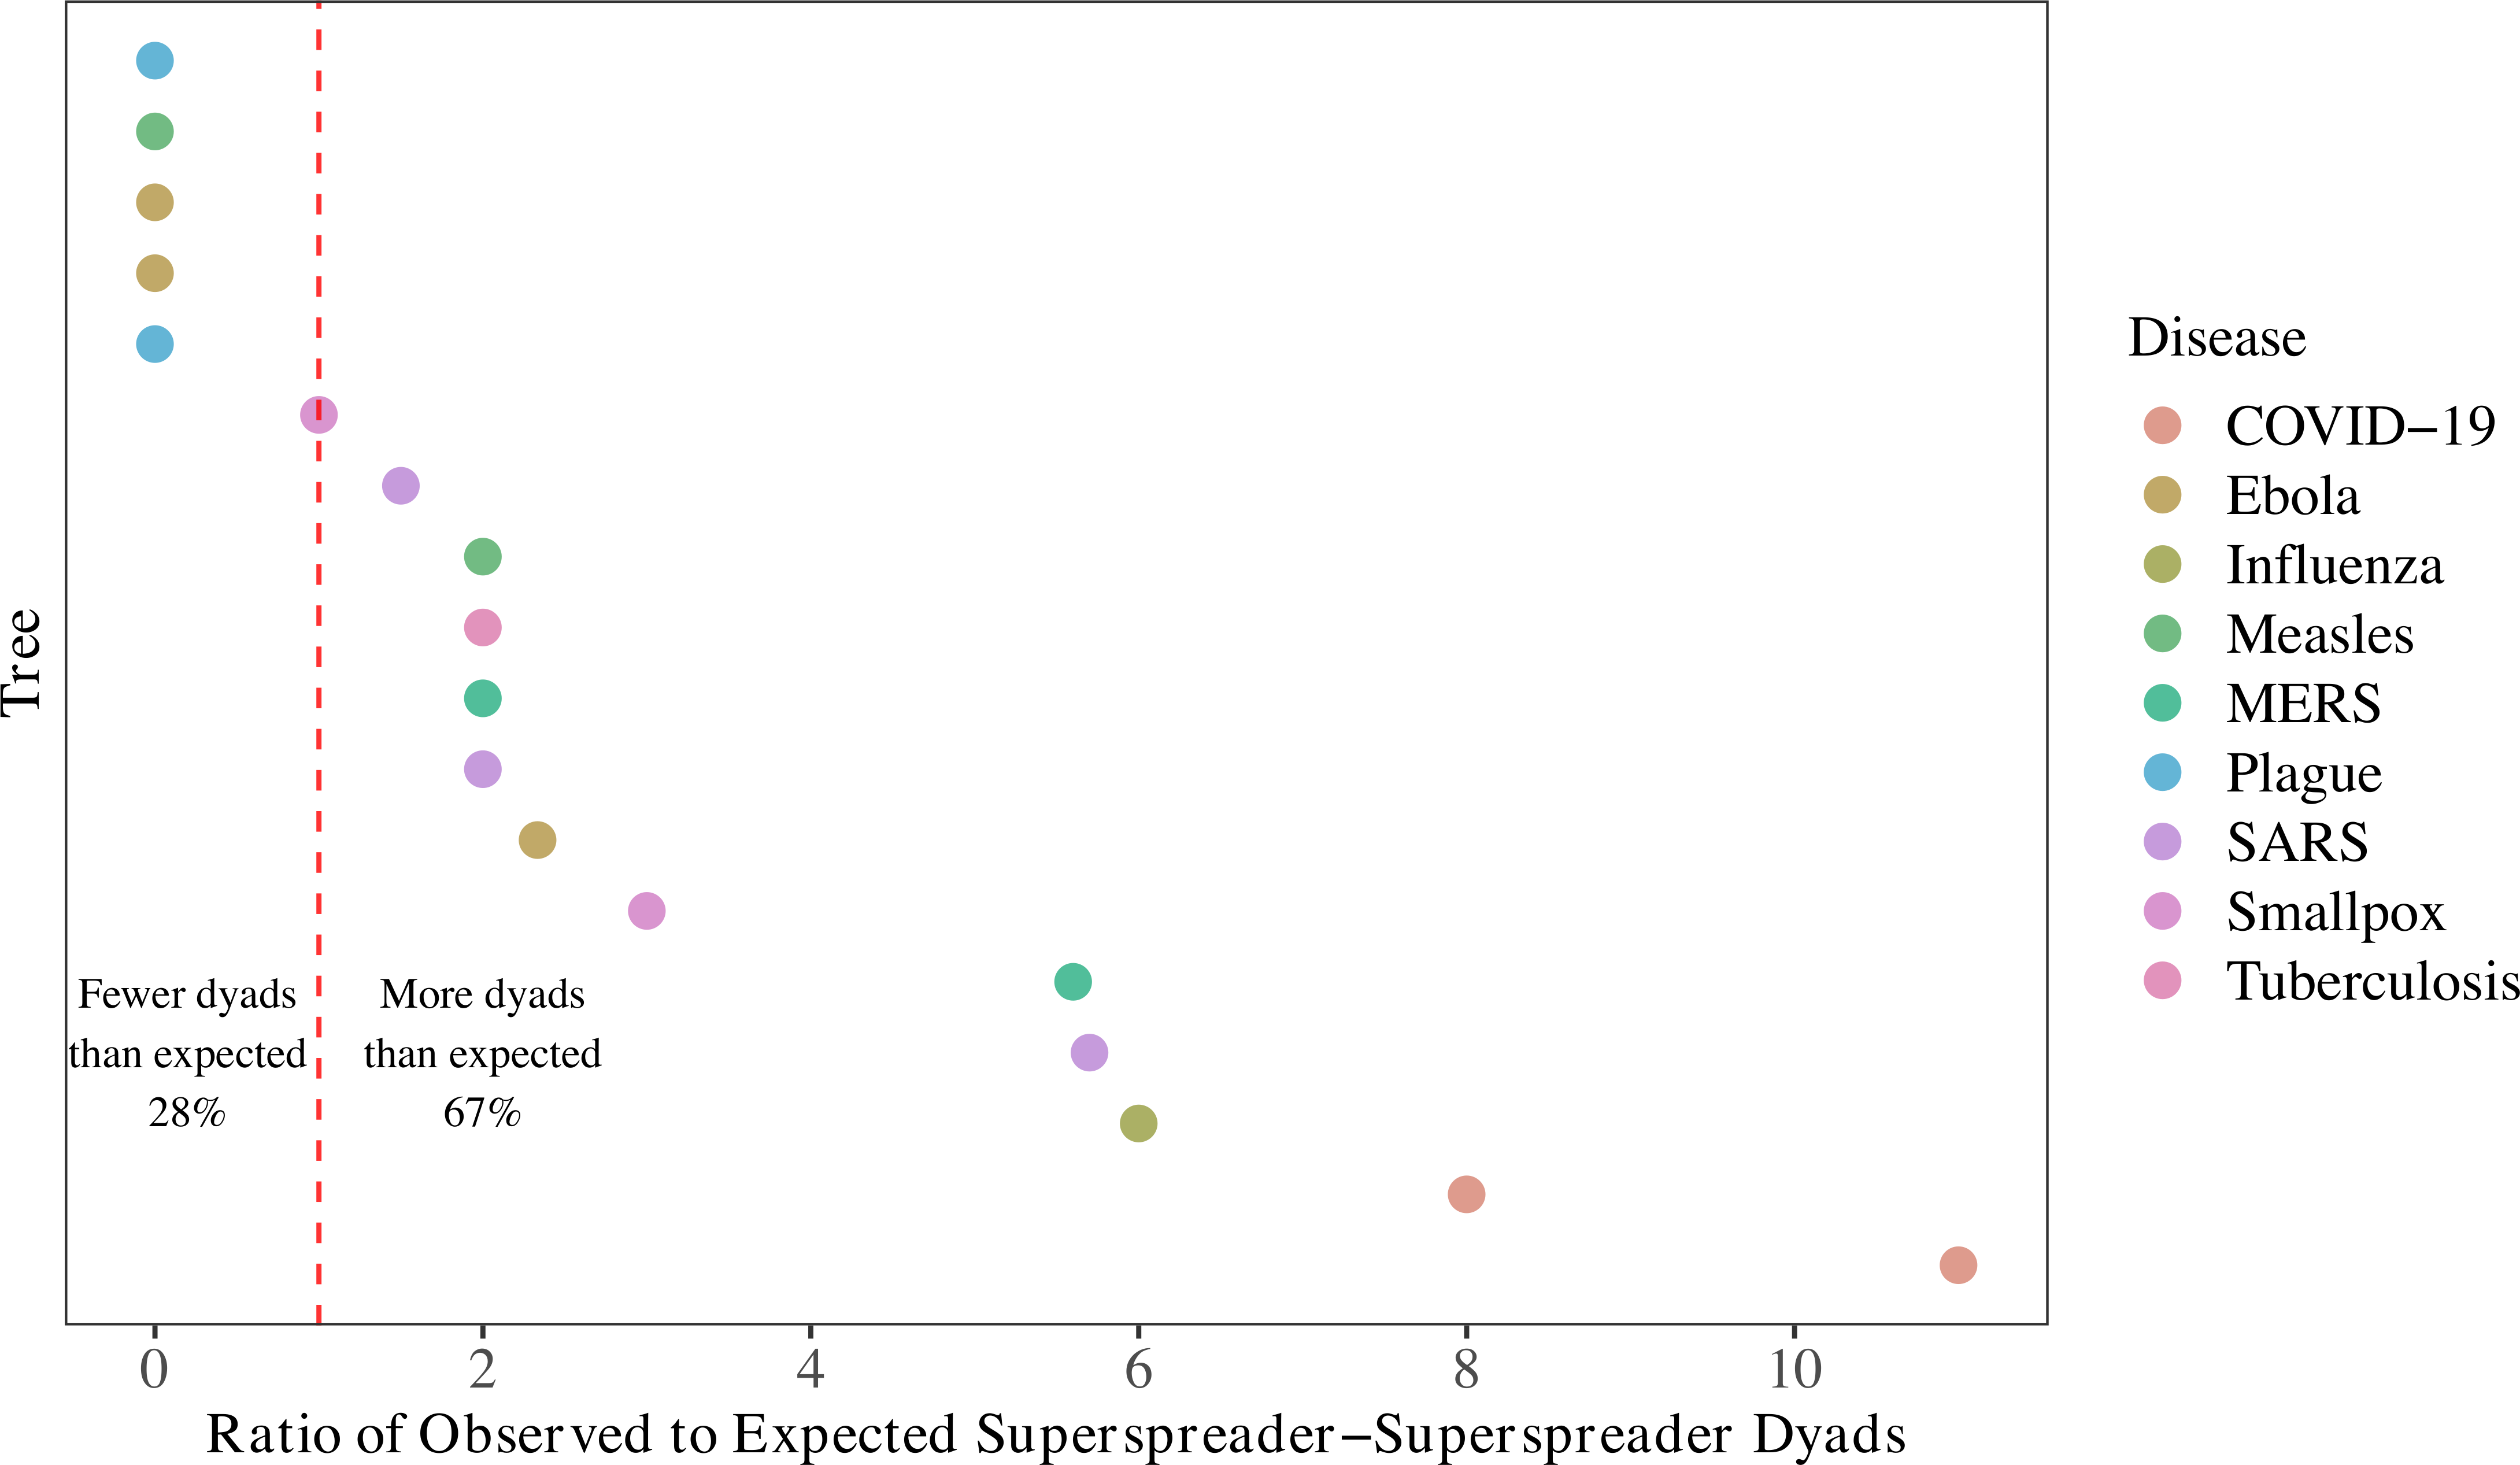
Lastly, we considered whether superspreaders generate other superspreaders: do trees have more instances of superspreaders infecting other superspreaders than we would expect by chance? Yes, in 12 of 18 eligible trees! This is an exciting question to explore in future work.
We encourage others to use the public database responsibly while being mindful of its limitations and biases.
