Contact patterns during the COVID-19 pandemic and at baseline
Published:
A summary of our paper: “Characterizing US contact patterns relevant to respiratory transmission from a pandemic to baseline: Analysis of a large cross-sectional survey”.
I previously shared a similar thread on Twitter and have expanded it here for clarity and posterity.
Why study contact patterns?
Contact (i.e. spatially proximate interactions between individuals) is critical for many modes of respiratory disease transmission and is a major component of disease models. Many disease models apply the homogeneous mixing assumption, where each person has the same number of interactions per unit time.
From surveys (e.g., POLYMOD) we know that there’s actually lots of variation in the number of contacts per individual & this heterogeneity affects disease spread. From network epidemiology theory (e.g., Bansal et al. 2007), we know that individuals with more contacts (aka higher degree) are more likely to be infected.
But we know little about contact patterns across the US! For example:
- Do different US regions have different contact rates?
- Are contact rates higher in the winter, potentially driving increased respiratory infections during this season?
- How do contacts vary with age, gender, and race?
We tackle these questions using a large survey in the US from June 2020 to April 2021.
Analysis
Contacts are defined as conversations >5 mins long with someone <6 ft away, or physical contact. We analyze the average number of contacts in each county for each week in the study period.
But, you might ask, these survey data are from early in the pandemic, so what does this mean going forward? Not to worry! We control for the effect of disease on contact and infer “baseline”, or non-pandemic, contact patterns in the US.
So what did we find?
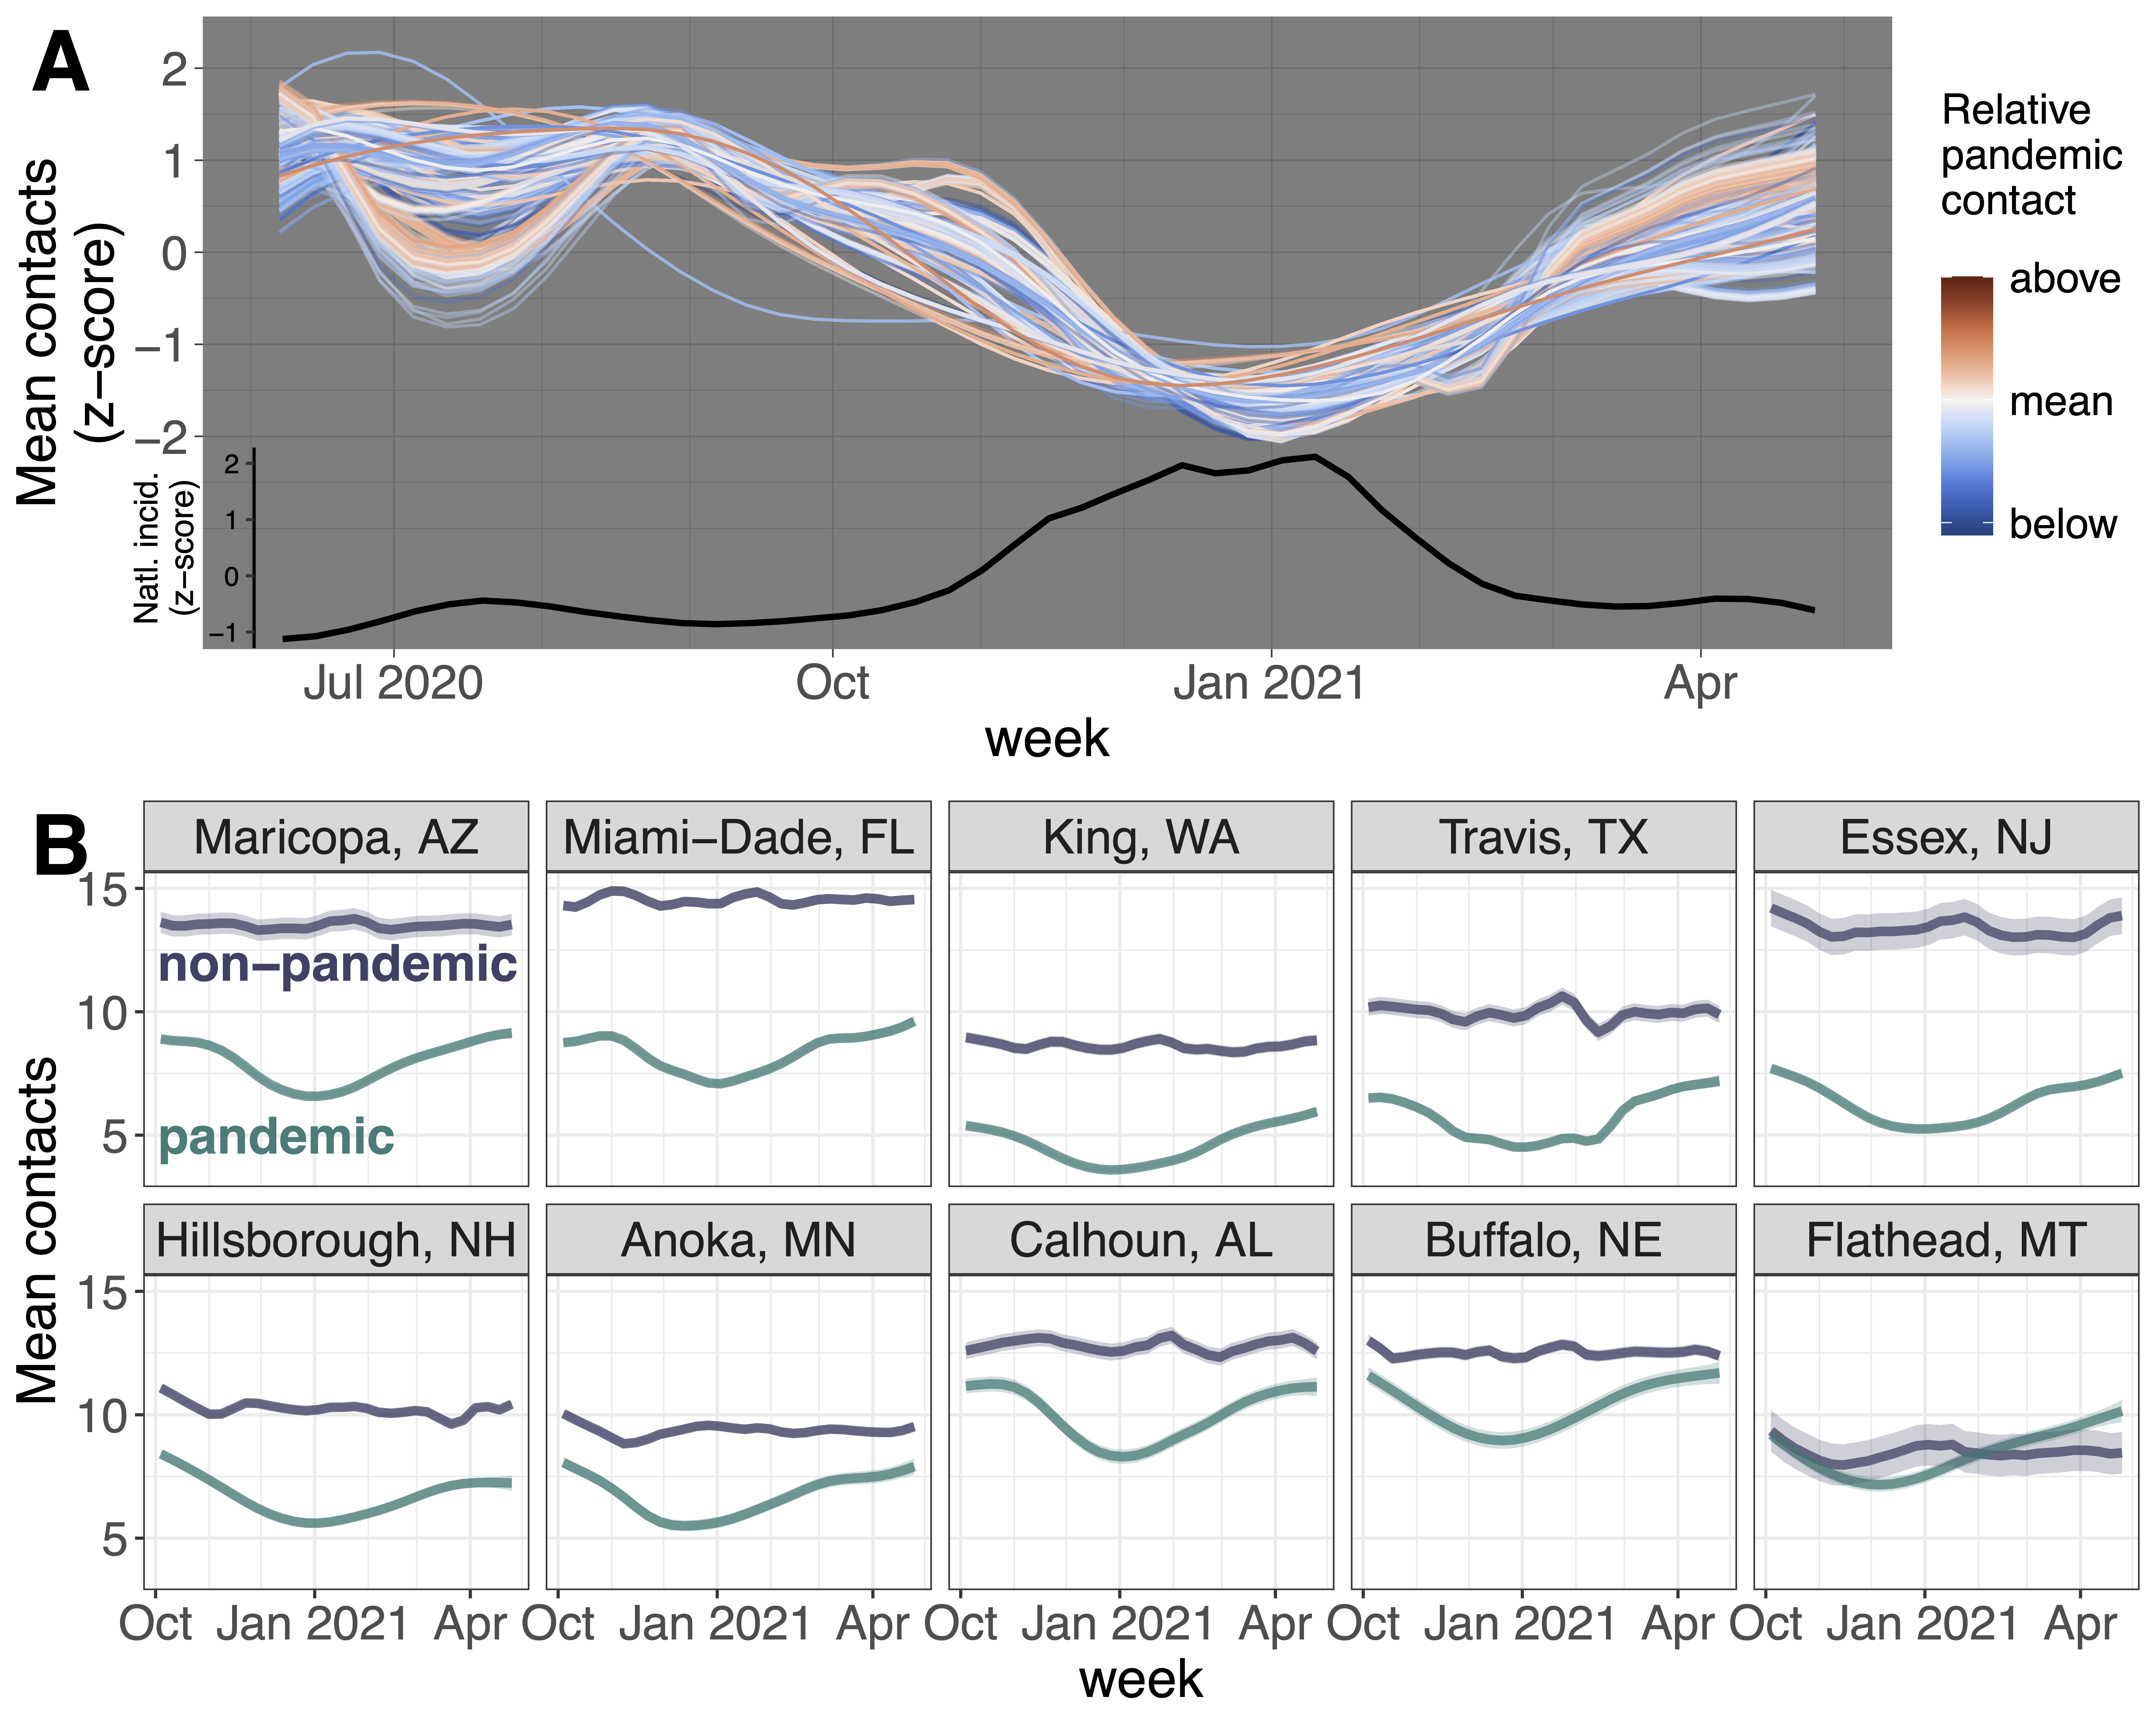
Early in the pandemic, contact varied over time. However, average contact rates were highly inversely correlated with national disease incidence.
After controlling for disease, there was no longer any systematic variation in contact over time.

If contacts aren’t changing much over time, then increased winter respiratory infections may be driven more by where contact is happening (i.e., more indoor interactions, see this thread) than an increase in overall contacts.
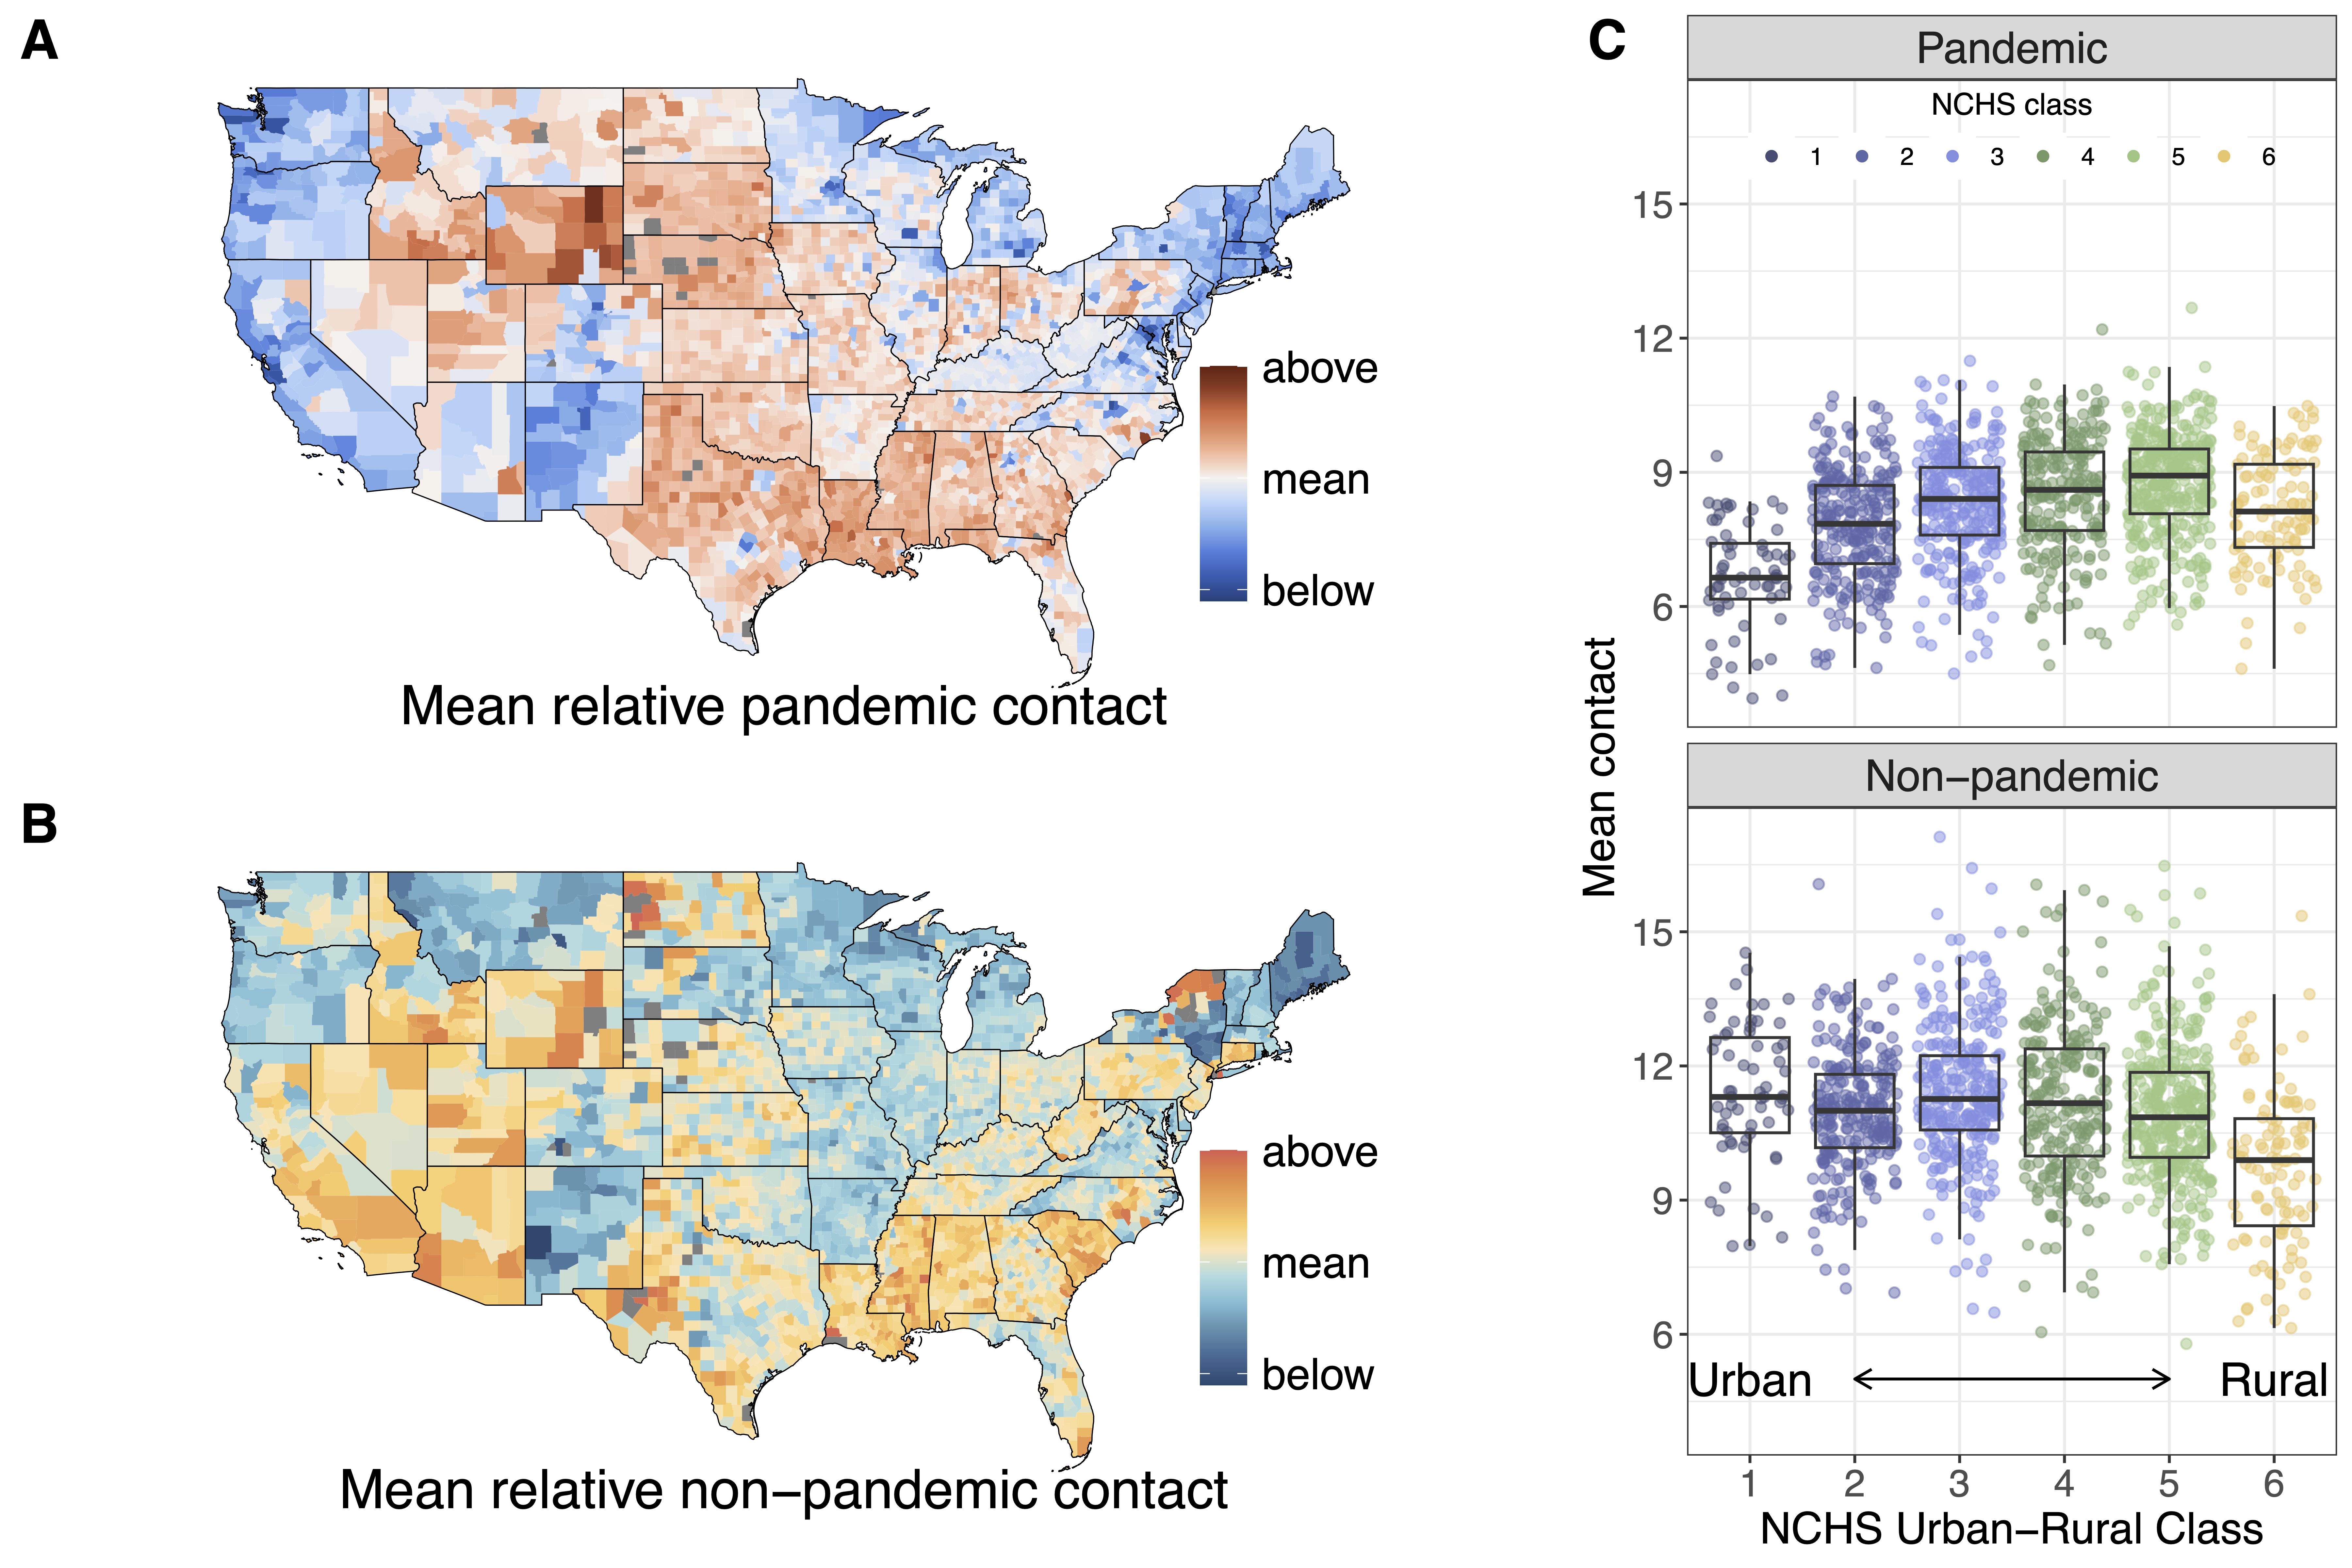
Contact patterns vary across US counties regardless of disease.
Based on population density, we expected urban counties to have higher contact rates. This is true at baseline but not during the pandemic, when urban areas were more responsive to gathering restrictions and thus had lower contact rates.

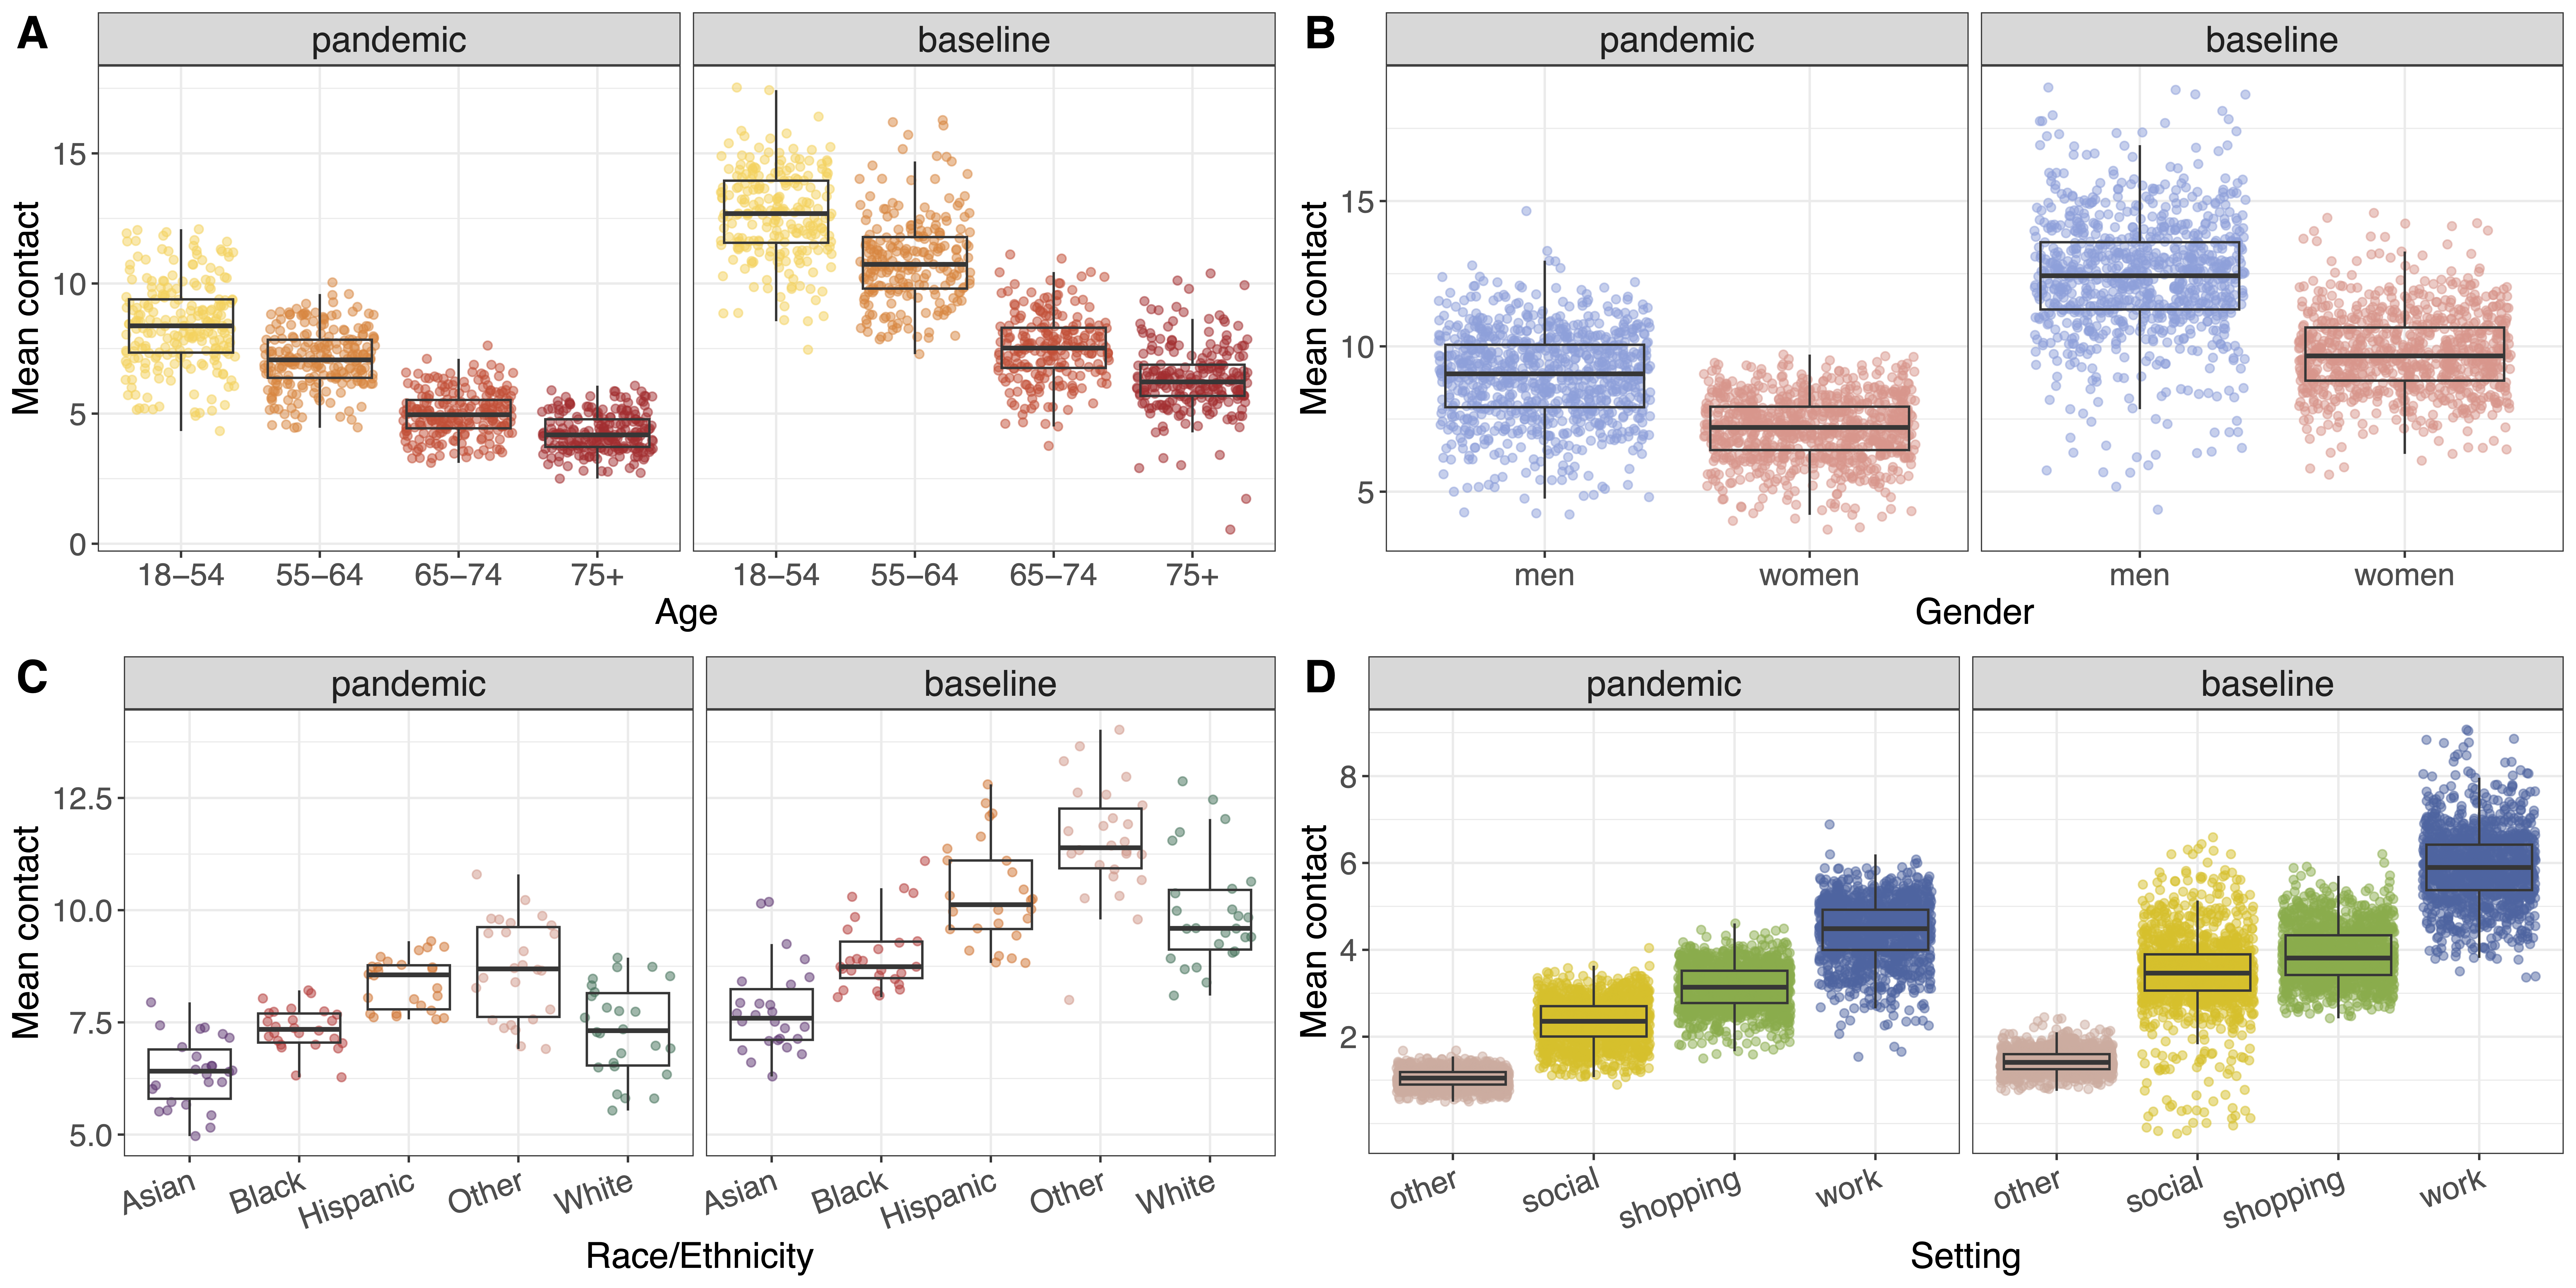
During the pandemic & at baseline, younger adults, men, and Hispanic and Black individuals have more contacts and thus are at greatest disease risk.
These geographic and social differences in risk can be used to target public health resources & surveillance.

In sum, our findings can help develop more accurate landscapes of transmission risk to facilitate more efficient interventions. We advocate for additional contact surveys in the US, especially focused on children and assortative mixing patterns (when people tend to interact more with others like them).
Our pandemic & baseline contact estimates are publicly available on github.
This study was made possible thanks to the data sharing of folks in the Delphi Group at Carnegie Mellon.
